
It was the early 1980’s, just after the debut of MTV and right before Apple launched the Macintosh personal computer. Future economics professor Campbell Harvey was considering what to study for his Ph.D. thesis at the University of Chicago. The world had just emerged from a traumatic recession, so he decided to see if there might be a way to anticipate the next slowdown. Intrigued by an academic paper written two decades earlier, he looked at whether the bond market held any helpful information, and panning through rivers of data, he found gold.
His economic eureka was that bond interest rates contained an early warning signal about the likelihood of a slowdown, or recession. The signal was embedded in the different amounts of interest income that bonds pay investors, depending on the length of the bond.
As Professor Harvey likes to explain it, when you walk into a bank to purchase a CD, you normally agree to buy a 5-year CD only if it pays you more than a 1-year CD. If you’re locking up your money for a longer period, you want to be paid for that. After all, you’re taking a risk that you might need your money before the CD matures. Also, the longer you have to wait, the higher the chance, however small, that something could happen to jeopardize repayment if the bank runs into any trouble.
Every once in a while, though, you might be willing to accept less money for the longer CD. Why? Perhaps you see economic trouble ahead and want to lock in today’s rate for five years, rather than take your chances that rates will have plummeted a year from now. In this situation, you grudgingly accept a lower rate on the longer CD in order to weather a potential economic storm.
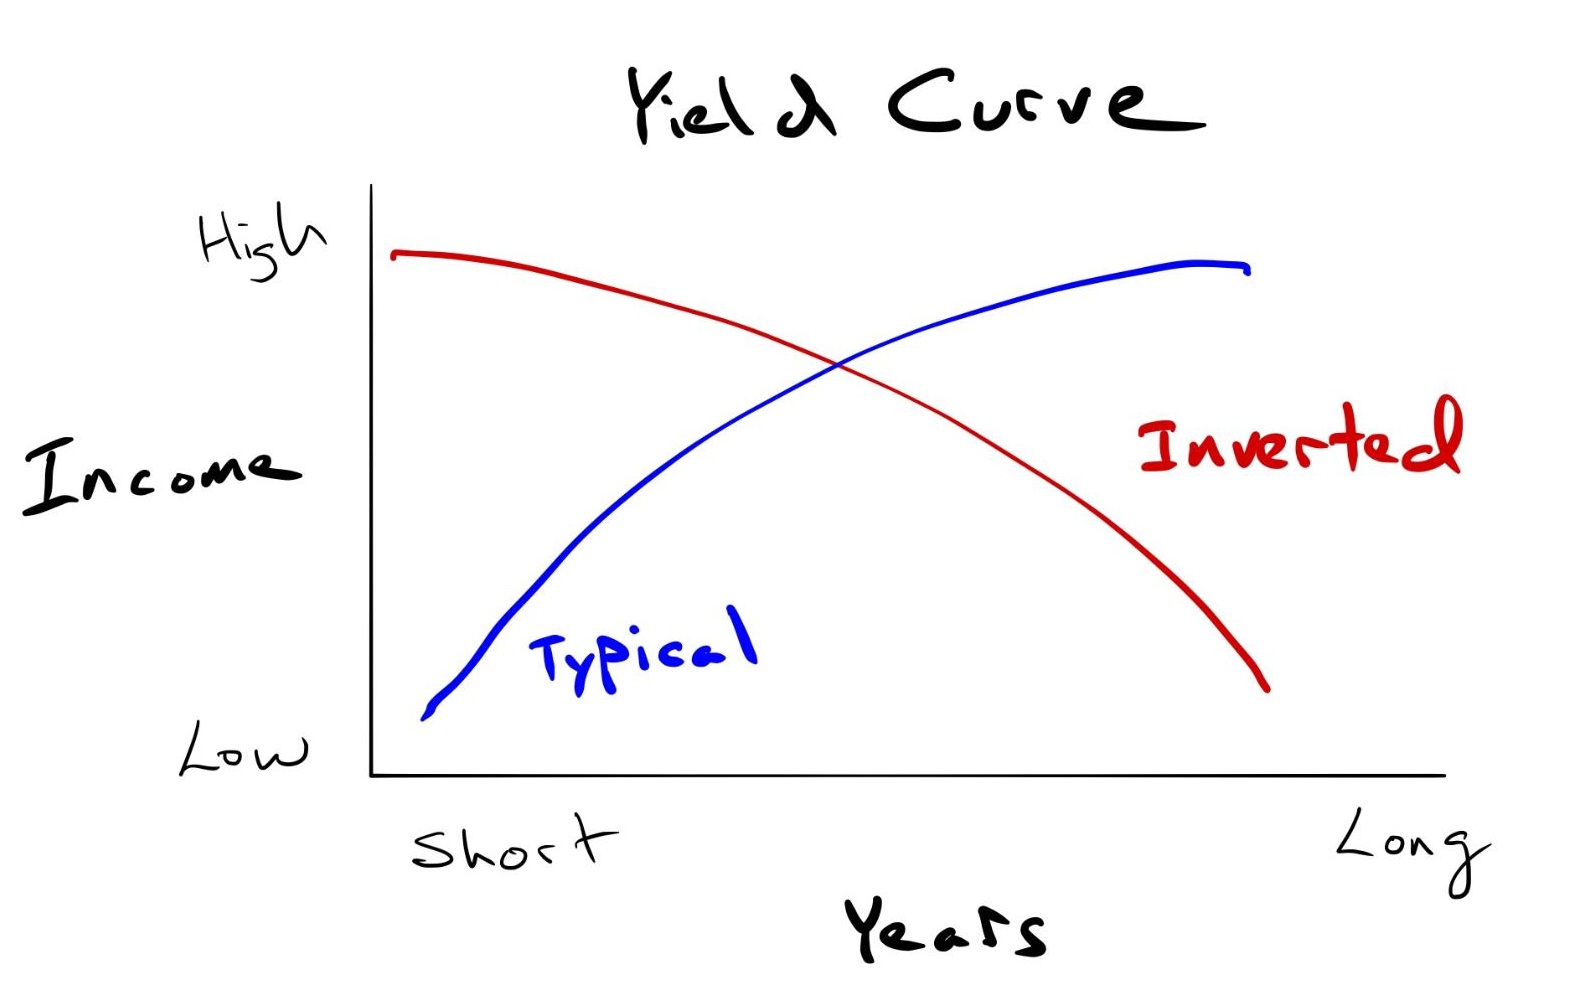
Economists use a simple line graph called the “yield curve” to show the different levels of interest that bonds of different lengths pay investors.
The chart below shows two curves - the typical one that we see when shorter bonds pay less interest than longer ones, and the “inverted” curve that happens when this relationship reverses and shorter bonds pay more interest than longer bonds.
It’s difficult to find a simpler, more elegant economic model than Professor Harvey’s yield curve. Still in his early twenties, somewhere between cups of ramen noodles in the wee hours of the night, he found the equivalent of a divining rod for gauging the direction of economic activity. Backed by the most illustrious dissertation committee in the history of economics, which included three future Nobel laureates, he wrote up his findings and launched an academic career that led him to Duke University where he is today.
Then, something truly stupendous happened: his model worked.
Most models cooked up in economic labs do a pretty good job of “retrodicting” things that happened in the past. Then they fall apart once they hit the light of the real world and are buried in the statistical graveyard. Harvey’s yield-curve model not only survived, but thrived in the real world, predicting every U.S. recession that followed, including the Great Recession ten years ago.
Central banks took notice. Here was a tool that could help them fulfill their prime directive of guiding economies through the business cycle. Today, if you visit the websites of the regional branches of the U.S. Federal Reserve in New York, San Francisco, and St. Louis, for example, you can find hundreds of studies, papers, and letters discussing the yield-curve model.
You’ll see that lots of questions remain about the model. Why does it work in the U.S., but not in some other countries? Can it still work now that the Federal Reserve has distorted the bond market with its “quantitative-easing”? What if interest-rate inversions don’t forecast recessions, but cause them by making banks reluctant to lend?
What you won’t see is much discussion of whether the yield curve can predict where stocks are headed. It wasn’t built for that and is as useful for market forecasting as using steel wool to polish your car.
This was the conclusion, so to speak, of one of Professor Harvey’s former dissertation advisors, Nobel laureate Eugene Fama. He and collaborator Ken French recently published a paper called Inverted Yield Curve and Expected Stock Returns in which they found “no evidence that inverted yield curves predict stocks will underperform Treasury bills for forecast periods of one, two, three, and five years." In other words, does Harvey’s yield curve contain any actionable information for investors? “Nope.”
Each recession and its effect on the capital markets is different. After the bond yield curve inverts, there’s usually a lag before a recession hits, during which stocks often continue to rise. Since over the last four decades the lag time has varied from ten to twenty-two months, investors trying to time the market often give up a lot of gains.
Far more money has been lost by investors preparing for corrections, or trying to anticipate corrections, than has been lost in corrections themselves. - Peter Lynch
The length of recessions also varies, making it hard to anticipate when it will be time to get back in the market, and, since stocks tend to shoot out of the gate before economic data arrives saying the recession has ended, market timers tend to miss most of the gains before they know it.
Some recessions are more regional, others more national or global in scope. Some recessions start and end quickly, others drag out for over a year. This stark variety makes it tough to model how stock prices might behave during the next one.
Given all this, unless you’re an economist or central banker, what good is Professor Harvey’s model?
It’s a warning signal, like the “Fire Danger” signs you see in national parks. When bond yields invert for ninety days or so, with shorter bonds paying more than longer ones, it’s time for the park ranger to push the needle from yellow to orange or red on the large wooden sign next to Smokey the Bear. When this happens, it’s time to inventory your exposure to financial risk.
Within your investment portfolio, do you have safer assets such as cash and bonds to help cushion potential stock declines? Outside the portfolio, how secure is your job? Do you have enough cash on hand for near-term living expenses, tuition payments, or the vacation you put on the credit card?
With the right preparation, it’s entirely possible that you could move through the course of a recession and, financially, not even feel it. They don’t last forever, and even during the worst of it, economic activity doesn’t come to a halt. New companies are still being formed, new products introduced; houses are bought and sold. Economic activity simply slows down for a time, often a period of six to eighteen months, and if you’re prepared to weather it without having to sell any of your assets at lower prices, you should be fine.
It’s amazing, though, how even smart people often ignore the danger signals. Here in San Francisco, during the Great Recession ten years ago, one of the city’s most distinguished law firms, Heller Ehrman, failed, in part, because it was using a bank line of credit to fund its operations. Founded in 1890, it had survived the 1906 earthquake and the Great Depression but keeled over in a matter of weeks because it lacked cash reserves and had “too much month at the end of the money.”
If Professor Harvey’s yield-curve model does nothing more than put us on alert and remind us to manage our financial risks, it will have done its job.